Data is Beautiful
3690 readers
1 users here now
Be respectful
founded 2 years ago
MODERATORS
1
2
3
1
Major global cities by the number of CCTV cameras per 1,000 people (2025)
(www.visualcapitalist.com)

4
On Mastodon, if you have an account on instance X, you can follow someone who is on instance Y. It creates a connection: X -> Y. If there are a lot of such follows, weight of this edge will increase, attractive force between points will be higher.
Original explanation on the page of Kaggle dataset:
"active users" graphs: For each instance, we consider the set of the 10K most recently active users. Then, for each user of an instance X, we consider the list of the users they follow, and add 1 to the edge from X to Y where Y is the instance the followed users. The weight of the edge from X to Y thus encodes how much the content seen on instance X is generated in instance Y. Note that this graph thus contains self loops.
I've tried to layout this dataset in Gephi, but it was a classic hairy ball - everyone is connected to everyone, amount of edges is too high comparing to number of nodes. Then, I've filtered out all EN instances and suddenly got a meaningful picture:

What can we see? If English-speaking instances are ignored, German, French and Japanese languages are most common across Mastodon. Japan and Korea don't hang around much with other folks, while French, German and Spanish instances are quite interconnected between each other.
Size of nodes depends on centrality, post about centrality of Peertube instances is here.


Same, but Fruchterman-Reingold algorithm instead of ForceAtlas 2:

Mastodon active users dataset can be downloaded here: https://www.kaggle.com/datasets/marcdamie/fediverse-graph-dataset-reduced

5
This is a graph of Peertube instances following each other. There are 942 nodes and 10067 edges.

On Peertube, an instance X can follow an instance Y to let its users see all the videos posted on Y. This graph is a directed graph.
Color and size of nodes depends on how big their Eigenvector centrality is. Nodes which have 0 centrality are blue and small, nodes with bigger centrality are big and red.
What centrality represents? Instances which are not followed by anyone have 0 centrality. Instances (A) with a lot of followers (B) have bigger centrality. If those followers (B) themselves have followers (C), it means centrality of A will be even higher.
Does it mean anything in context of Peertube? I'm not sure. Considering chain of three instances: (A) <- (B) <- (C), when (A) posts a video, does it appear in (C)? Probably not. But if it was so, then centrality would've mean this: Videos posted on instances with high centrality spread across entire network, while videos posted on instances with 0 centrality are not visible anywhere else.
Here are top 10 instances and their centrality:
- http://tilvids.com/ 1.0
- http://share.tube/ 0.97
- http://conf.tube/ 0.90
- http://video.lqdn.fr/ 0.88
- http://skeptikon.fr/ 0.86
- http://spectra.video/ 0.74
- http://video.monsieurbidouille.fr/ 0.73
- http://aperi.tube/ 0.71
- http://tube.aquilenet.fr/ 0.71
- http://video.hardlimit.com/ 0.68
How to repeat this graph visualization
- Download latest Peertube
instances.csvandinteractions.csvfiles here: https://www.kaggle.com/datasets/marcdamie/fediverse-graph-dataset-reduced - Import them to Gephi;
- Apply
Giant Componentfilter to remove nodes which are not connected to biggest network; - Apply
ForceAtlas 2layout; - Run
Eigenvector centralityStatistics (directed). It will add a new column to nodes table; - Apply
Nodes - Color - Ranking - Eigenvector centrality; - Apply
Nodes - Size - Ranking - Eigenvector centrality; - Configure Preview and export.

P.S. On colorful image used as thumbnail of this post nodes are colored by Modularity (community detection).


7
Explanation and article: https://boilingsteam.com/cachy-os-is-now-the-most-popular-distro-on-proton-db/

8
9
10
11
12
13
1
Excerpt:
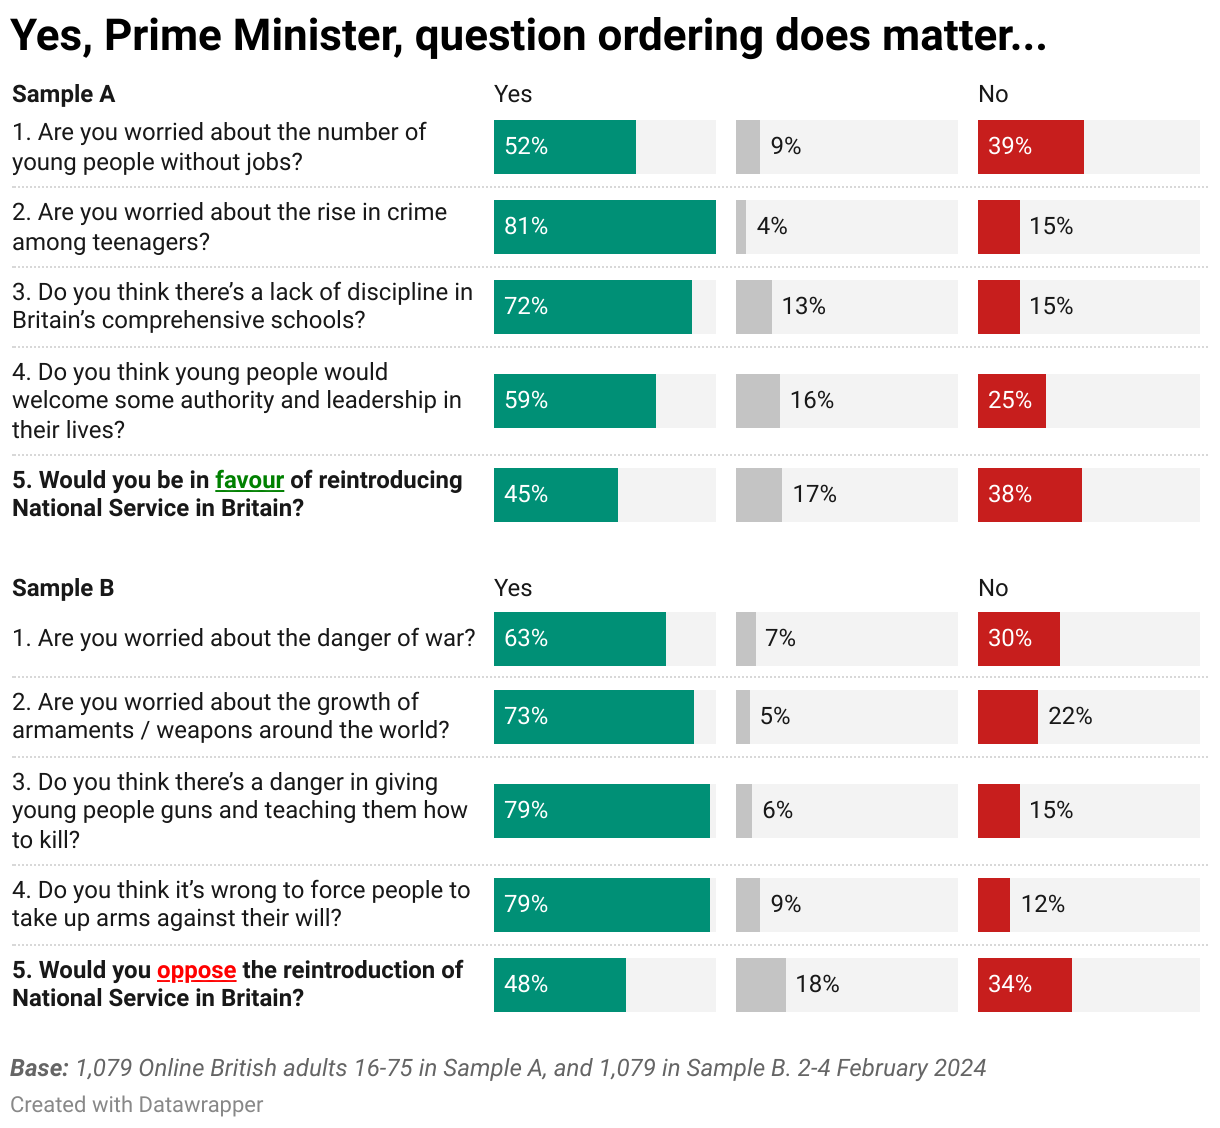
In a famous Yes, Prime Minister episode Sir Humphrey Appleby once explained to Bernard Woolley how you could get contradictory polling results on the same topic – in this case the reintroduction of national service – by asking a series of leading questions beforehand and asking the key question you want to know about in a certain way. The clip is here.
But what would happen if we asked Sir Humphrey's questions today? To find out we asked 1,000 British adults the first set of questions that were positive about national service and 1,000 British adults the second set that were negative. Below is a comparison of the results. You can see that it is indeed true that you get different results on the level of support for the reintroduction of national service based on the way you ask the question and the questions you ask before it.
https://www.ipsos.com/en-uk/yes-prime-minister-questionnaire-design-matters


17
cross-posted from: https://lemmy.world/post/43115555
Here’s an overview of community efforts to make The Files more accessible. I’ve written a small description and possible warnings alongside them.
Epstein Research GitHub Mirror
- A mirror for all the files
- ⚠️ Microsoft owns Github
- https://github.com/rhowardstone/Epstein-research
Jmail
- Access Jeffrey Epstein’s emails through a gmail interface and star important ones.
- https://jmail.world/
Track The Files
- A sourced, transparent investigation into the public figures named in the Epstein files — and the tax dollars that flow to them.
- ⚠️ Made with LLMs
- https://trackthefiles.org/
Epstein Document Network Explorer
- This is a network analysis tool for exploring relationships between people, places, and events captured in the Epstein emails released by the House Oversight Committee.
- https://epstein-doc-explorer-1.onrender.com/
EpsteIn
- See which of your LinkedIn connections appear in the Epstein files.
- https://github.com/cfinke/EpsteIn
3D Network Cloud
- Another visualisation tool
- https://epstein.dugganusa.com/
Epstein Archive
- ⚠️ Made with LLMs, seems stale*
- https://epstein-docs.github.io/
Please add more sources as comments, or let us know if one of them has gone dark or appears to be dodgy.


19
Tom Gayner’s Q4 2025 portfolio reflects a masterclass in long-term capital allocation, with total holdings valued at $12.54B across 128 positions. Berkshire Hathaway remains the cornerstone at 12.84%, followed by a significant 8.31% stake in Alphabet. The portfolio is well-diversified into industrial and financial giants like Brookfield (4.78%), Amazon (3.74%), and Deere & Company (3.26%). This strategy emphasizes high-conviction "compounding engines" that balance steady growth with tech dominance.

22
23


view more: next ›