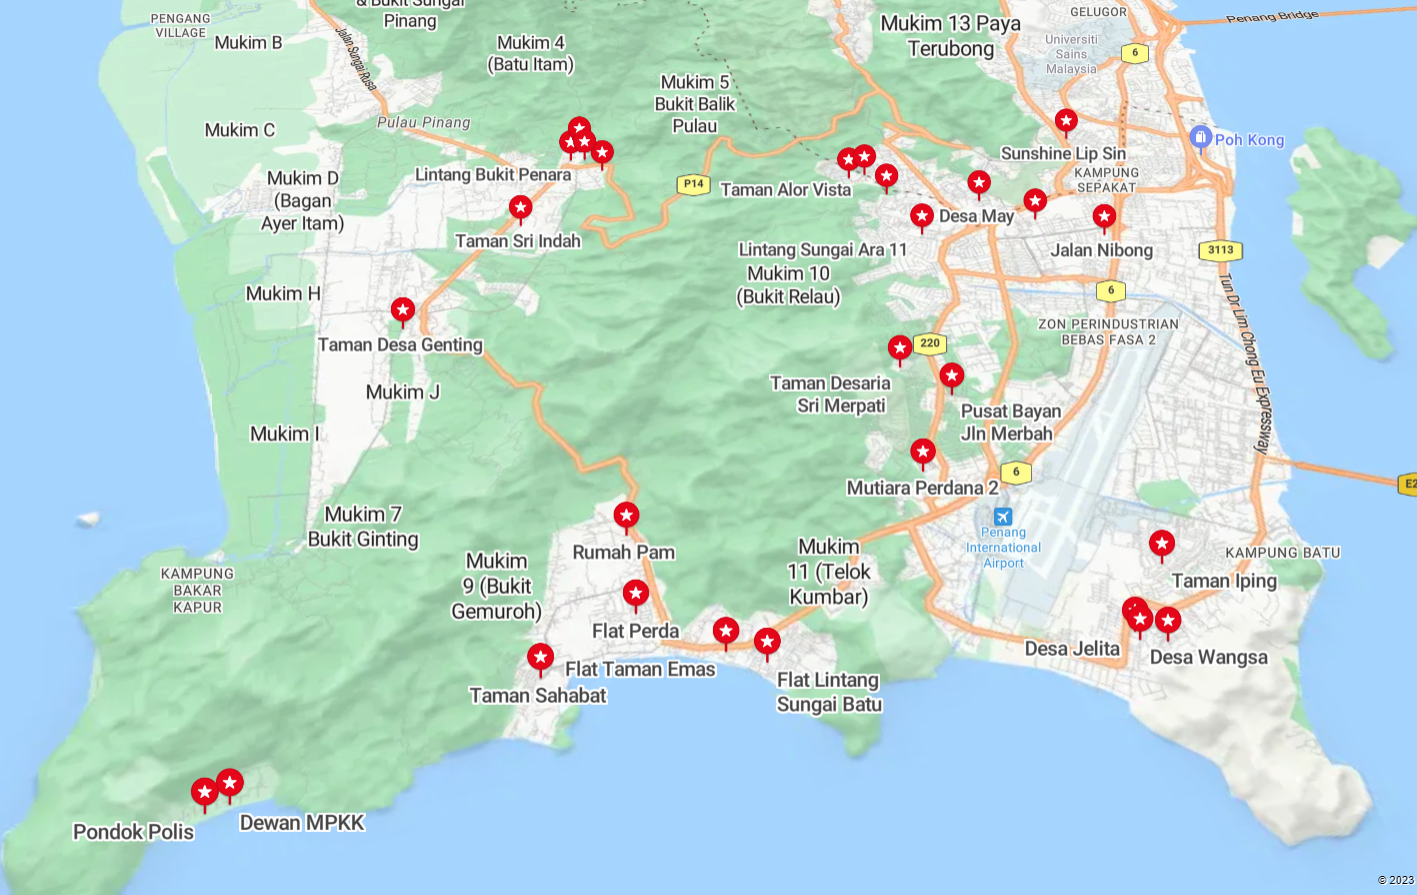
Northern pins zoomed in below. 🐘 indicates parked water containers nicknamed "elephants" with a capacity of 24000 L. Emoji not shown in header image and first image below.
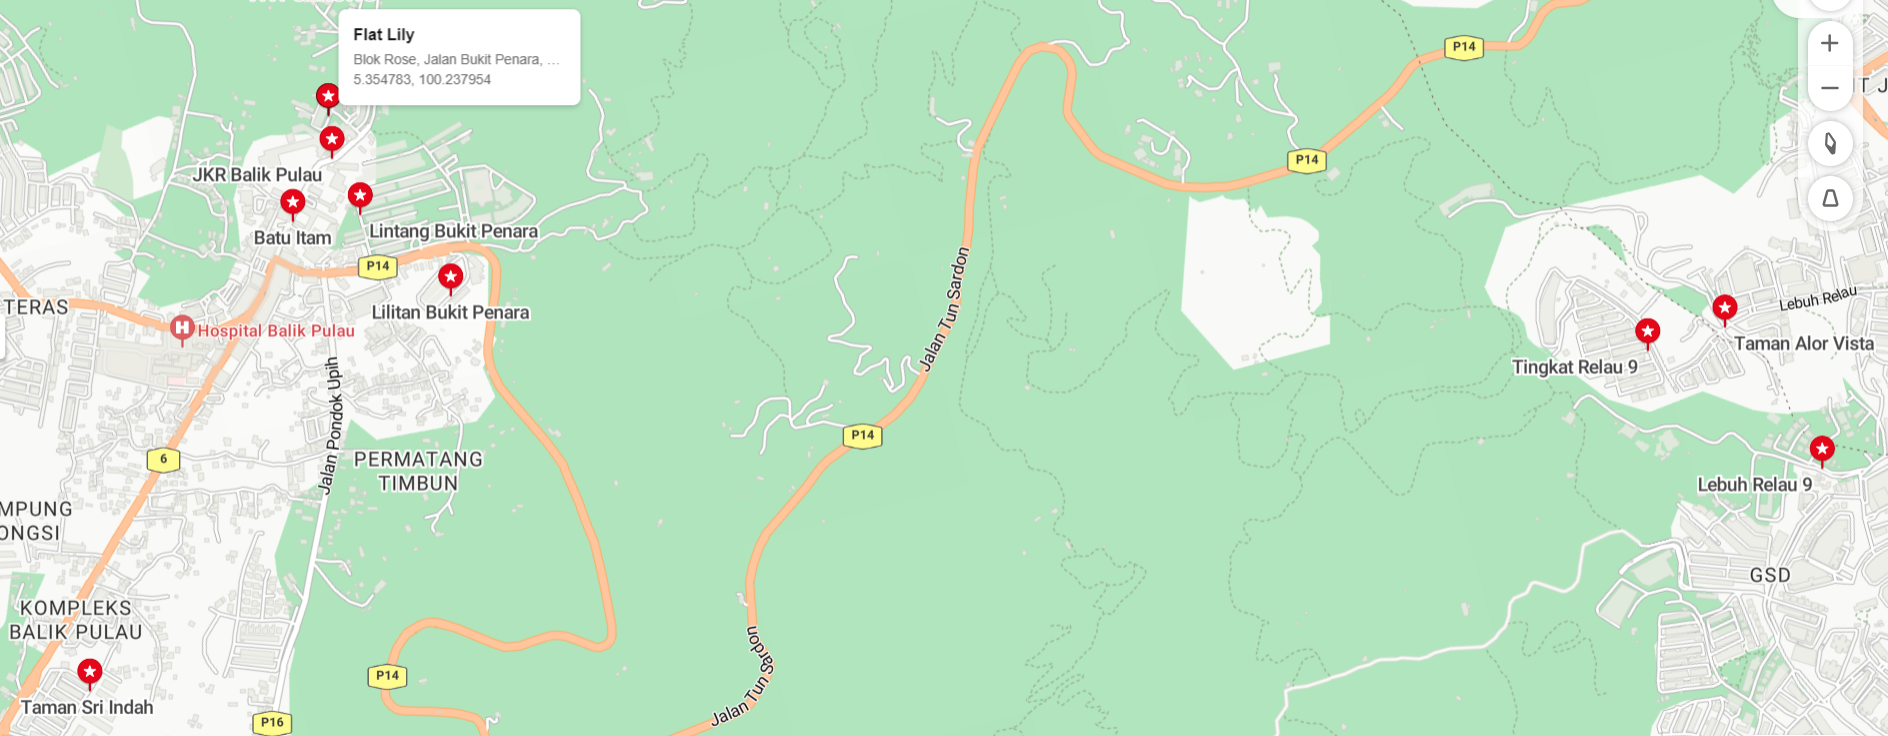
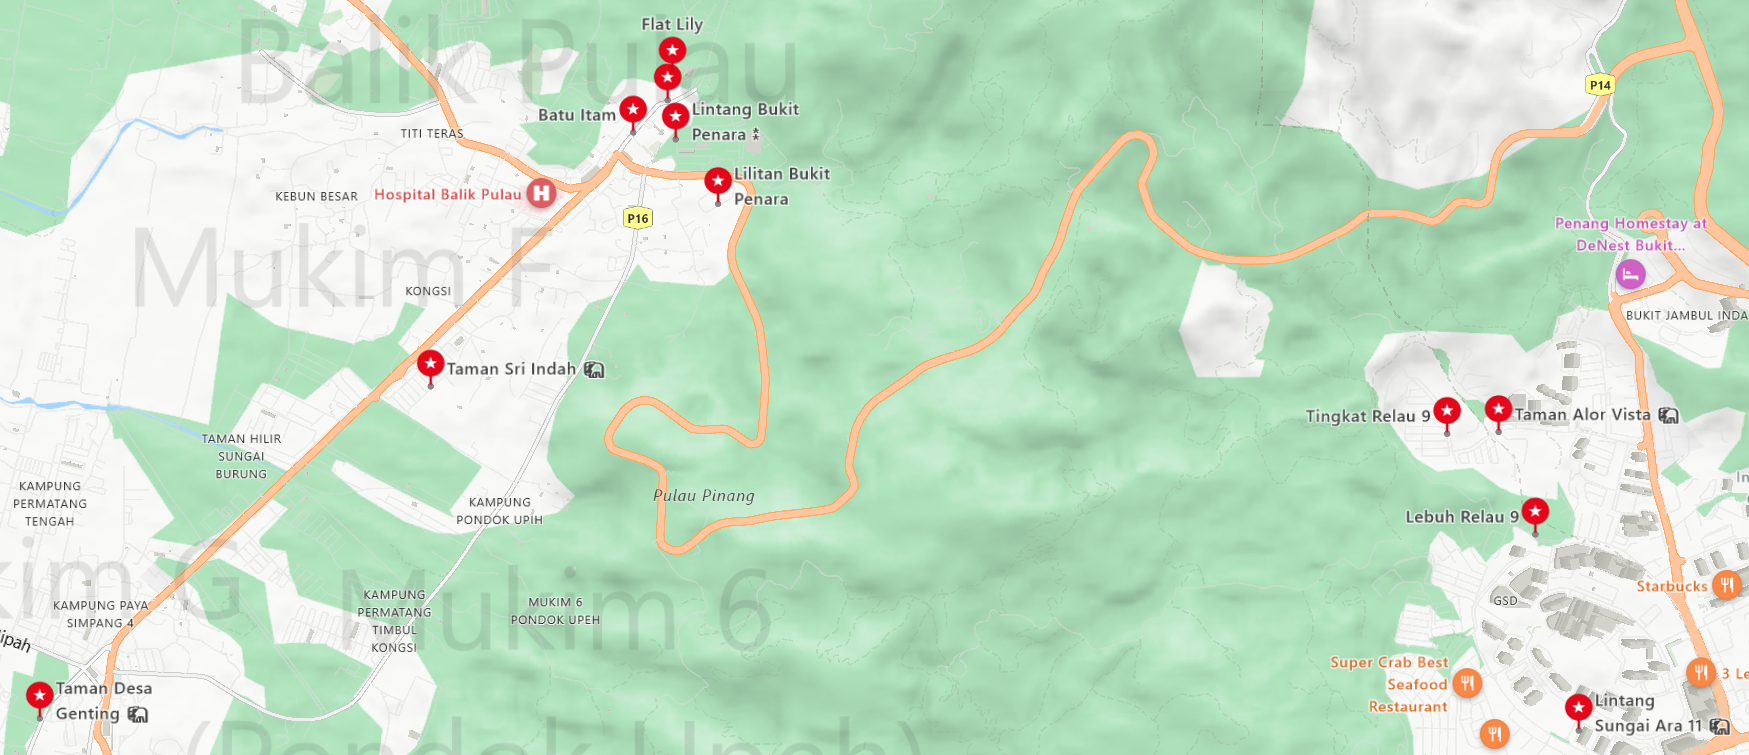
Pins indicate static water tanks with at least 2500 L capacity, with ⁑ symbol meaning two of these water tanks in close proximity. Coordinates supplied here.
I must say the mapping service I use (Bing Maps) don't display the pin labels well relative to other labels on the map. OSM and Here might be better. Not using Google on purpose.
A continuation of this post on GTFS Static.
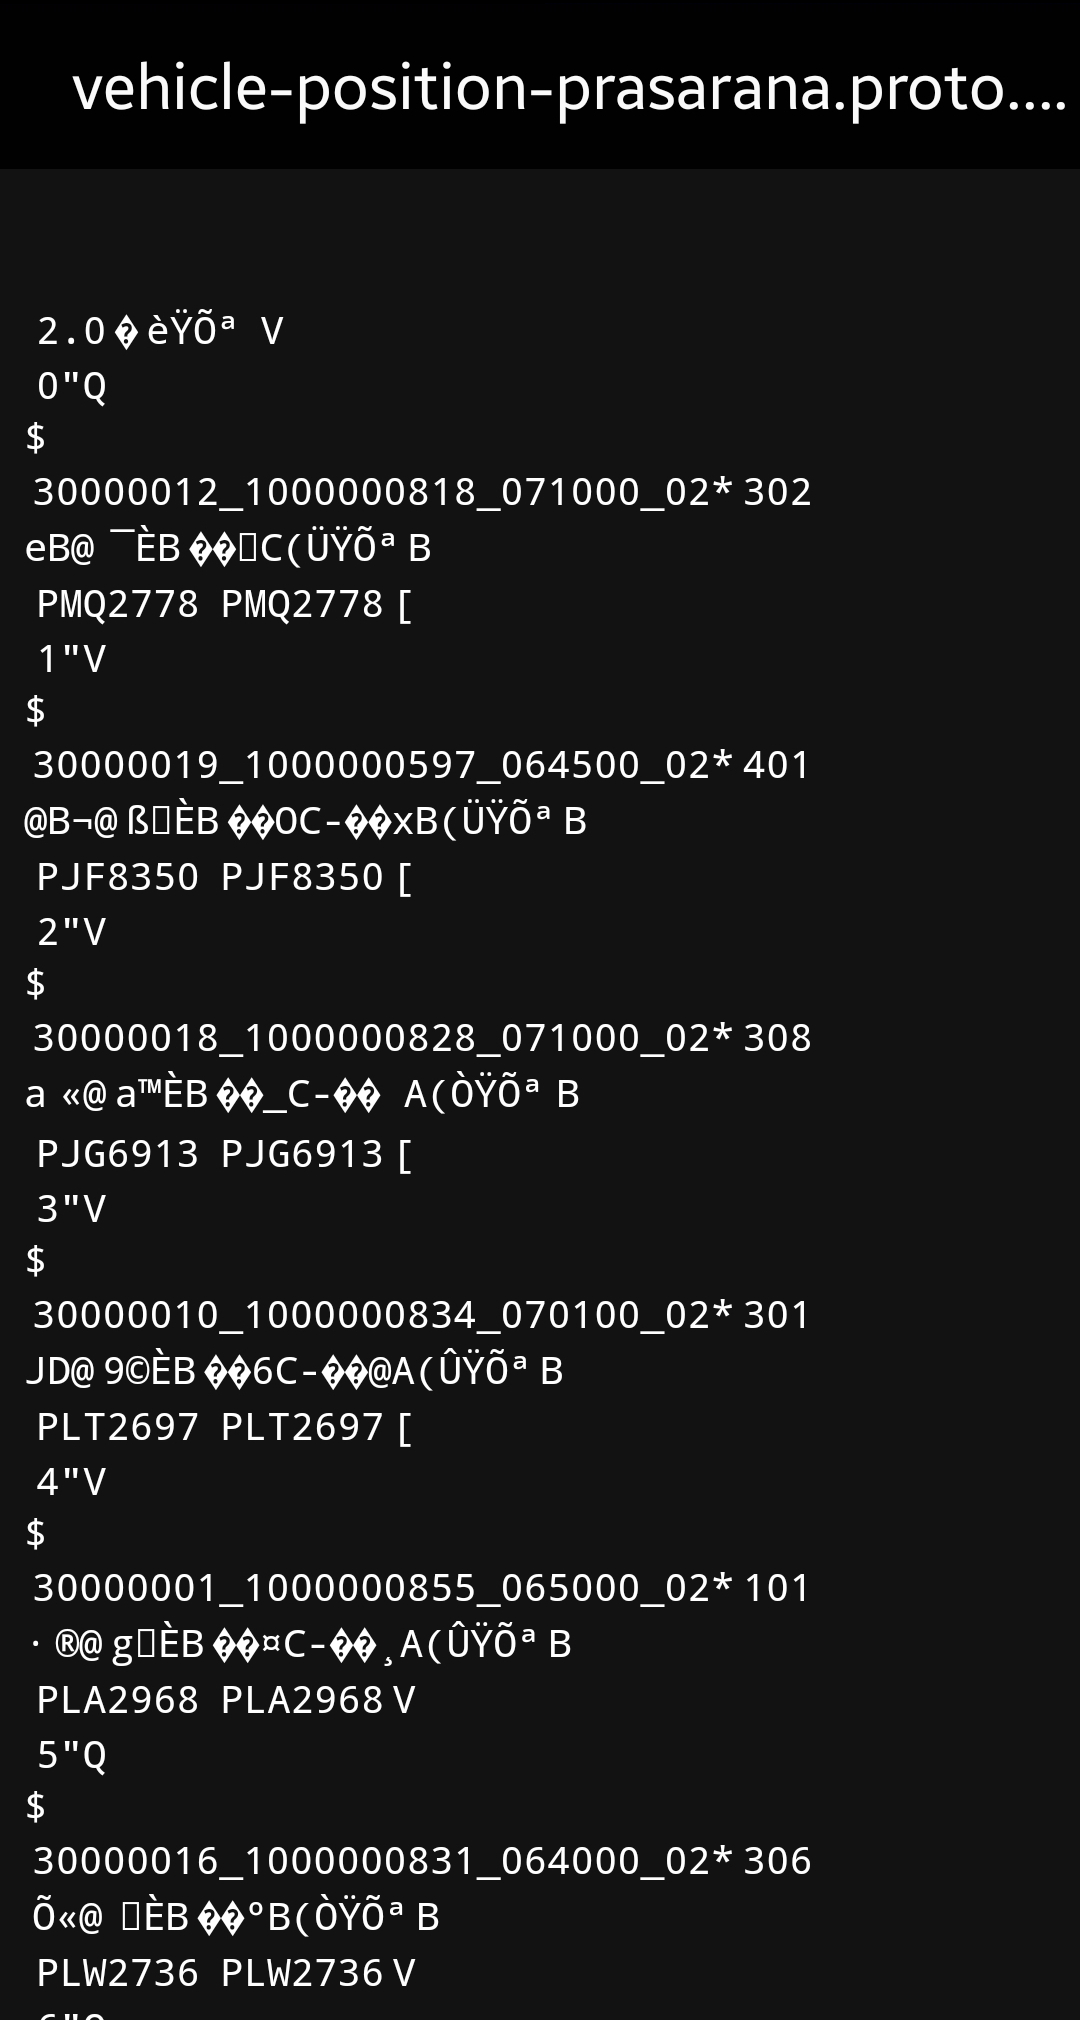
The files involved in GTFS Static are basically plain text. In GTFS Realtime though, if you attempt to load the protobuf file, you'll get something like the snapshot picture attached to this post.
Took me a while, but I finally got a Python IDE, fixed some code bugs and got the output I wanted. There may or may not be a Part 3 to this, depending on how much free time I have.
If you don't already have a general-purpose or Python-specific IDE, you can install PyCharm Community Edition. Set up a new project, then install and update the following packages: gtfs-realtime-bindings, pandas, requests. That should be sufficient for your IDE to recognize the code header given in their sample code.
from google.transit import gtfs_realtime_pb2
from google.protobuf.json_format import MessageToDict
import pandas as pd
from requests import get
The rest of the code is actually fine, although at first I wondered why print(df) produced a truncated table, as shown below.
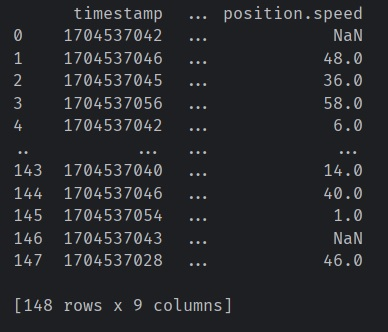
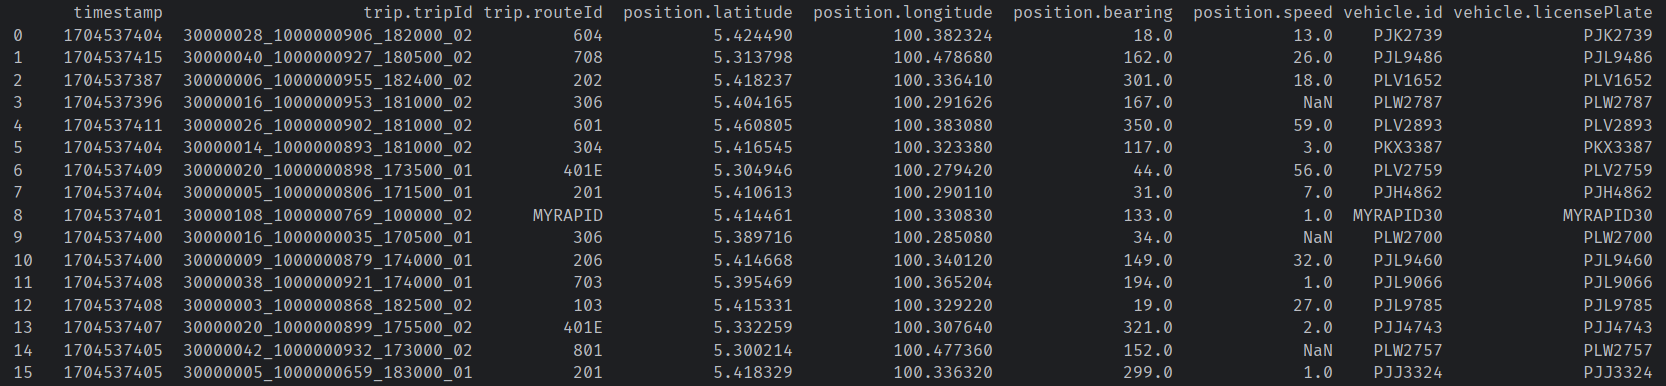
Later I found out pandas (that did the work converting JSON into a flat table) has options to set how you want the table displayed. Full documentation available here, but the ones relevant to this code are pd.set_option('display.max_rows', ###), display.max_cols and display.width. Once the correct values are entered, I got the console to display what I wanted.
Yeah, I'm being very succinct on purpose. If you tried the above steps yourself and got stuck anywhere, feel free to ask me in the comment section. The next step for me would be to visualize this data. I've seen snapshots around but not a web interface to load the protobuf or GTFS-R (and static info) source to easily digest the live transport data. This looks like another free-time project for me queued up.